LLM Inference Is a Full-Stack Systems Problem
In brief
In brief
LLM inference performance emerges from coordination across model computation, GPU execution, memory allocation, and serving policy. A useful diagnosis connects each latency symptom to the layer that owns it.
- Transformer equations define the work, but kernels determine how efficiently hardware executes it.
- KV-cache capacity and layout constrain concurrency independently of raw compute.
- Serving latency depends on queueing, batching, prefill, decode, and streaming policy together.
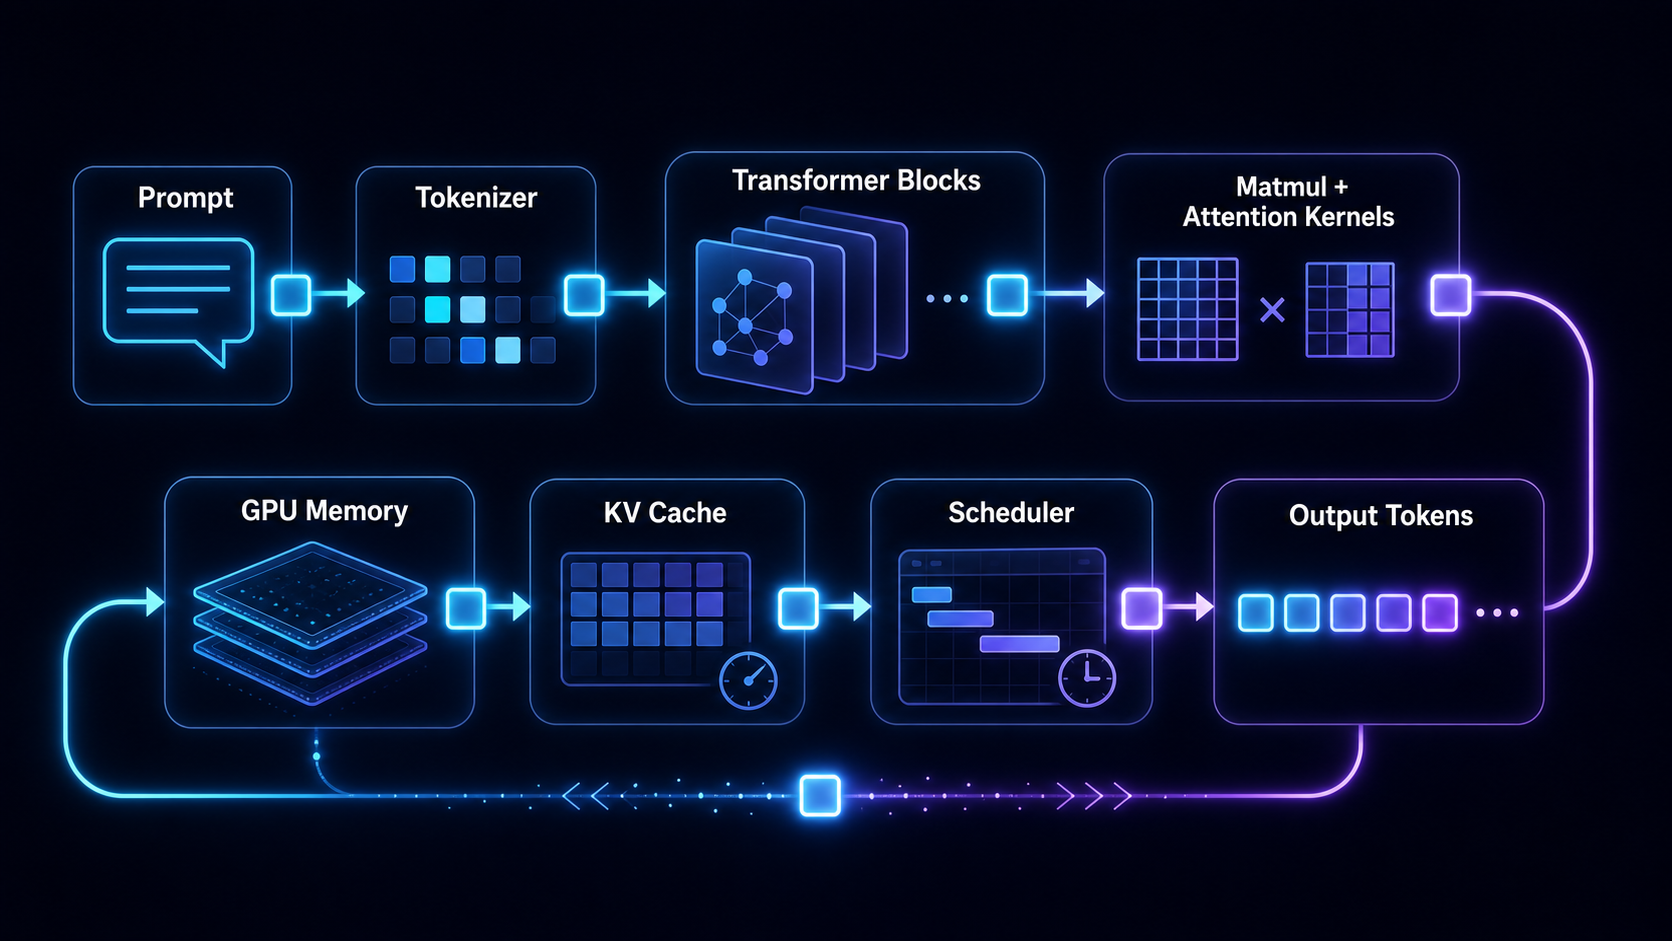
Why understanding modern LLM inference requires model, kernel, and serving views.
When a streamed response slows down, "is the model slow?" is usually the wrong first question. It is too coarse to diagnose. From the outside, the API call still looks like text in and text out. Inside the server, that same call has already turned into token IDs, activation tensors, kernel launches, KV-cache blocks, scheduler decisions, and streamed output tokens.
Those objects create different failure modes. A long prompt can delay the first token before decode begins. A skinny decode batch can leave tensor cores underused. KV-cache pressure can delay admission, force recomputation or preemption, or reject work even when arithmetic capacity is available; the exact behavior depends on the engine and configuration. A scheduler can keep the GPU busy while making an interactive user wait.
That is why this series starts with the full stack rather than a single Transformer diagram. The tokenizer maps text into token IDs. The Transformer maps those IDs into contextual hidden states and next-token logits. GPU kernels turn that math into matrix operations and memory movement. The serving engine decides which requests run, how they batch, and where their cached state lives.
The useful map keeps these layers separate without letting them drift apart. A latency symptom should point to the next measurement: model cost, kernel efficiency, cache pressure, or scheduling policy.
LLM inference is the coordination of token computation, GPU execution, and request scheduling.
That coordination problem shows up as token count, GPU batch shape, live KV-cache blocks, and requests waiting behind the current scheduler step. A useful way to name the hidden object is the request state at scheduler step
This is a diagnostic state vector, not a literal in-memory schema. Real engines split, overlap, or omit pieces of it depending on their executor, cache manager, and request protocol. The point is to keep the objects that create different bottlenecks visible at the same time.
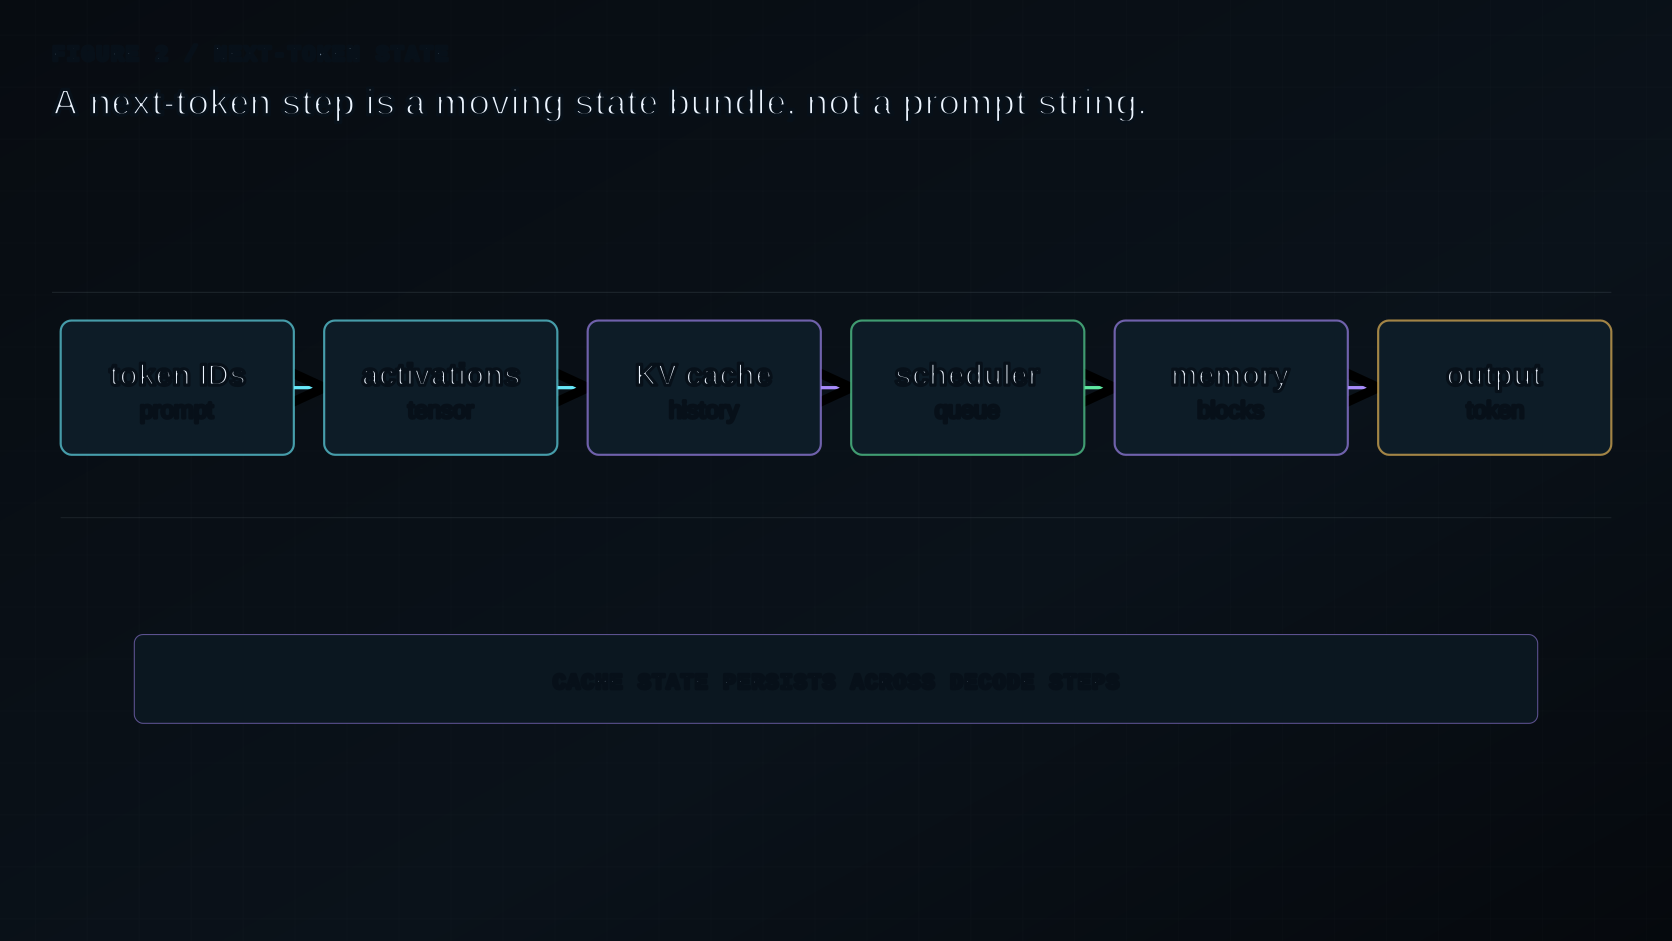
A Concrete Next-Token Pass
Start with one ordinary request, but read it as an inference engine has to read it: not as text, but as state that will consume compute, memory, and scheduler attention.
Suppose a user sends a short chat prompt:
Explain why KV cache matters for LLM inference.The API surface treats this as a short text prompt. The model server cannot stop there. Its first durable object is a list of token IDs, plus request metadata such as sampling parameters, maximum output length, stop conditions, priority, and arrival time. If this is a chat model, the raw user message may also be wrapped with system, assistant, or tool tokens before tokenization. The model sees that formatted token sequence, not the UI message.
During prefill, the Transformer processes the prompt tokens together. Each layer builds intermediate hidden states. Attention projects those hidden states into queries, keys, and values. MLPs transform each token vector independently. At the final position, the model produces logits for the next token. The sampler chooses one token from those logits.
At that point, the model story has become a systems story. The prompt is now work that must be scheduled and memory that must be owned.
The QKV projections and MLP projections are matrix multiplications. Those matmuls become GPU kernels. The kernels need weights and activation tiles to move through HBM, cache, shared memory, registers, and tensor cores in a staged order. If the data path is poor, theoretical FLOPs do not turn into delivered token throughput.
The request is also not alone. The serving engine may have dozens or thousands of active requests. Some are still in prefill. Some are decoding. Some have long contexts. Some are almost finished. The scheduler has to decide whether this request enters the next batch, whether its prefill should be chunked, how many tokens fit the current budget, and whether enough KV-cache blocks are available.
When the first output token is sampled, the request moves into decode. Now the system repeats a smaller step many times. Each new token needs a forward pass for the newest position, but it reads the historical keys and values from KV cache. The cost has shifted: less prompt-wide parallel work, more repeated cache access and scheduling pressure.
At the serving boundary, total latency is a sum of waiting, setup, repeated decode work, and output streaming:
This is a causal decomposition, not a stopwatch identity. Serialization, network transfer, sampling, and scheduler work may overlap with GPU execution, and different APIs place streaming overhead at different boundaries. It is still useful because it tells us which component to measure before calling a response "slow."
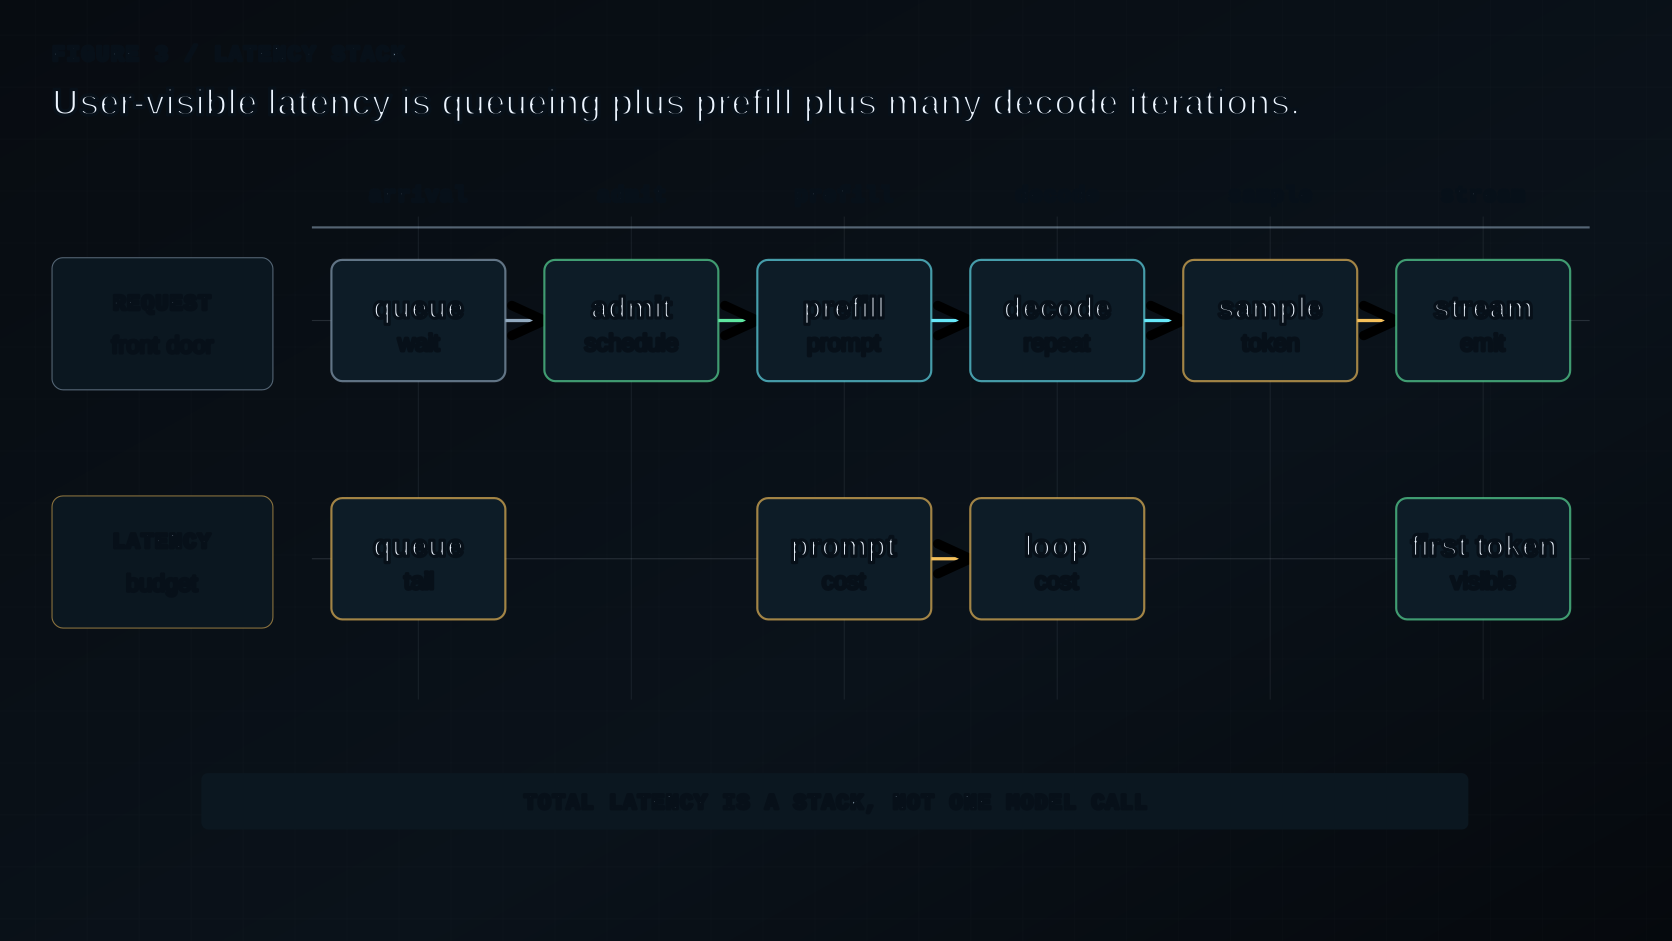
That is how the same model can look fast in one benchmark and feel slow in a product. A single prompt on a warm GPU measures one clean path through the stack. Production traffic measures prompt lengths, output lengths, cache pressure, batch shape, kernel efficiency, and scheduling policy colliding at once.
The User Sees Text. The System Sees State.
The first boundary is tokenization. The model does not process characters, words, or sentences directly. It processes integers from a vocabulary, then looks up vectors for those integers in an embedding table.
From there, the user-facing string is gone. The system is moving tensors and request state.
During the prompt phase, often called prefill, the model processes the full input sequence. Each token receives a hidden state that can use information from earlier allowed positions. The output at the final position is projected into logits over the vocabulary. Sampling or decoding logic turns those logits into a next token.
Then the system repeats. The generated token is appended to the sequence, the model computes the next logits, and another token is sampled.
The naive version would recompute the entire prompt at every step. Real systems avoid that by storing keys and values from previous tokens in a KV cache. The architecture creates the need for cached attention state, but the serving system has to allocate, reuse, evict, and move that state under load.
This is also why prompt length has two different meanings. For the model, a longer prompt means more token positions that can contribute context. For the serving system, it means more prefill work before the first token and more KV-cache memory after prefill finishes. The same user-facing feature, "support long context," changes both computation and capacity planning.
View 1: The Model View
The model view asks what computation the request creates before asking whether the system schedules it well.
In a dense decoder-only Transformer, a token moves through a stack of blocks. Each block alternates between operations that act independently on each token and operations that allow tokens to communicate.
The split is:
MLP changes what a token contains. Attention changes what a token can see.
The MLP is a per-position transformation. It takes a token vector, expands it into a larger feature space, applies a nonlinearity or gate, and projects it back. The same learned weights are applied to every position.
Attention is different. It constructs queries, keys, and values from token vectors, compares queries to keys, applies masks, and uses the resulting weights to mix values. In a causal language model, a token can see previous tokens but not future ones. With packing, segmentation masks can also prevent tokens from one document from attending into another document. With long-context architectures, attention may combine local and global patterns to reduce cost while preserving long-range access.
Inference then separates into two phases:
- Prefill processes many prompt tokens at once and builds KV cache.
- Decode processes one or a few new tokens per request while reading the existing KV cache.
Those phases use the same model weights, but they stress the system differently.
View 2: The Kernel View
The kernel view asks whether that computation gives the accelerator usable work.
Transformer layers are full of matrix multiplications. Query, key, and value projections are matmuls. MLP projections are matmuls. The output projection into the vocabulary is a matmul. Even attention contains matrix products, although optimized attention kernels are more subtle than simply materializing the full attention matrix.
GPU performance matters because the model graph only says "multiply these matrices." The GPU implementation decides whether that multiplication reaches a meaningful fraction of available throughput.
Arithmetic is only part of the problem. GPUs have enormous compute capacity, especially through tensor cores, but that compute helps only if data arrives at the right time and in the right layout. A high-performance matmul kernel is mostly a data-movement strategy around a compute core.
The hardware has a memory hierarchy: global memory, L2 cache, L1 cache, shared memory, registers, and specialized tensor core pipelines. Moving data from global memory is expensive compared with reusing data close to the compute units. Tiling is the central trick. Instead of treating a matrix multiplication as one huge operation, the kernel breaks it into tiles small enough to reuse in shared memory and registers. Good kernels overlap memory movement with computation so tensor cores stay busy.
From the model view, a linear layer is a clean equation. From the kernel view, it is a scheduling problem across warps, registers, shared memory, and tensor cores.
View 3: The Serving View
The serving view asks how irregular user requests share the same model and hardware without turning latency into a queueing accident.
Systems like vLLM sit at this layer. A model executor can run a forward pass. An inference engine has to decide which forward passes happen, how requests are batched, how KV cache is assigned, and how outputs stream back.
Production traffic is irregular. One user sends a short prompt and asks for a paragraph. Another sends a long document and asks one question. Another has a shared system prompt that many requests repeat. Some requests are in prefill. Others are decoding. Some are about to finish. Some need structured decoding constraints. Some may benefit from prefix caching or speculative decoding.
The serving layer turns those differences into policy.
Continuous batching replaces a fixed batch with a scheduling loop. At each step, the engine can admit new requests, continue decoding active requests, retire finished requests, and feed the GPU with runnable prefill or decode work. That matches online inference, where requests arrive continuously and have different lengths.
It does not guarantee high utilization or low latency by itself. A long prefill, a cache-constrained request mix, small decode batches, or an unsuitable admission policy can still leave capacity idle or make already-streaming requests wait.
The KV cache becomes a system object here. It is no longer merely a tensor produced by attention. It is memory that must be allocated, addressed, reused, and released. Paged attention treats KV cache more like virtual memory: requests can own logical token blocks that map to physical cache blocks. This reduces waste and fragmentation compared with requiring each request to occupy one large contiguous region.
The serving view also changes how we think about fairness. A scheduler that always maximizes GPU utilization can hurt latency for short interactive requests. A scheduler that always favors low latency may leave throughput on the table. A scheduler that admits too much prefill can delay decode for requests that are already streaming. These are not model-quality tradeoffs. They are product-facing systems tradeoffs.
Consider two requests that arrive together. One has a 200-token prompt and asks for 50 output tokens. The other has a 20,000-token prompt and asks for one sentence. The long prompt may dominate prefill compute and cache allocation, even though its output is short. If the scheduler runs the long prefill as one large job, the short request may wait. If the scheduler chunks the long prefill, the short request may start streaming sooner, but the engine has to manage more scheduling steps. The right choice depends on the product goal.
The Three Views Are Not Optional
Each view rules in a different kind of failure.
If the model is expensive, every token brings too much work. Large hidden size, many layers, many heads, long context, and large vocabulary projections all add cost.
If the kernels are inefficient, the model may have enough theoretical hardware but low delivered utilization. The bottleneck might be global memory bandwidth, poor tiling, low tensor core occupancy, register pressure, or suboptimal attention kernels.
If the serving engine is inefficient, the GPU may sit underused even though the kernels are fast. Poor batching, prefill blocking decode, fragmented KV cache, missed prefix reuse, and bad admission control can all show up as high latency or low throughput.
Inference performance should not be collapsed into one number. Tokens per second, time to first token, inter-token latency, memory utilization, tail latency, and cost per generated token all describe different parts of the system.
The first split is:
- If time to first token is high, look at tokenization overhead, queueing delay, prefill length, prefill batching, and whether repeated prefixes are being reused.
- If inter-token latency is high, look at decode batch shape, KV-cache reads, attention kernels, sampler overhead, and whether the scheduler is mixing work well.
- If throughput is low but latency is acceptable, look at GPU utilization, batch formation, tensor-core use, and whether requests are too small or too fragmented to feed the hardware.
- If tail latency spikes under load, look at long prompts, long generations, cache exhaustion, preemption, and admission control.
No one engineer has to debug every layer personally. The first job is to measure the layer that is actually failing. A model engineer, kernel engineer, and serving engineer may all be looking at the same slow response from different angles. The shared map keeps those angles connected to the same incident.
The shared map matters because optimizations often move bottlenecks. Quantization may reduce weight bandwidth, then reveal KV-cache bandwidth. A better attention kernel may improve decode latency, then expose scheduler overhead. Prefix caching may reduce prefill compute, then increase memory pressure because cached prefixes need space. A larger batch may improve throughput, then worsen tail latency. None of these outcomes are contradictions. They are signs that LLM inference is a coupled system.
This also changes how teams should read incidents. If users report slow first tokens after a new long-context feature ships, the first question should not be "did the model get worse?" It should be: did prompt length increase, did prefill batches change, did cache allocation become tighter, and did scheduler policy still match the traffic? The answer may involve all four.
Likewise, if an optimization improves offline throughput but hurts chat latency, that is not necessarily a failed optimization. It may be an optimization for the wrong workload. Full-stack inference work starts by naming the workload precisely.
The workload here is online next-token generation: active requests with different prompt lengths, shared accelerators, and latency that users see while tokens stream. That is the setting where model equations meet queues, batch formation, KV-cache limits, and partial progress.
A Simple Stack Diagram
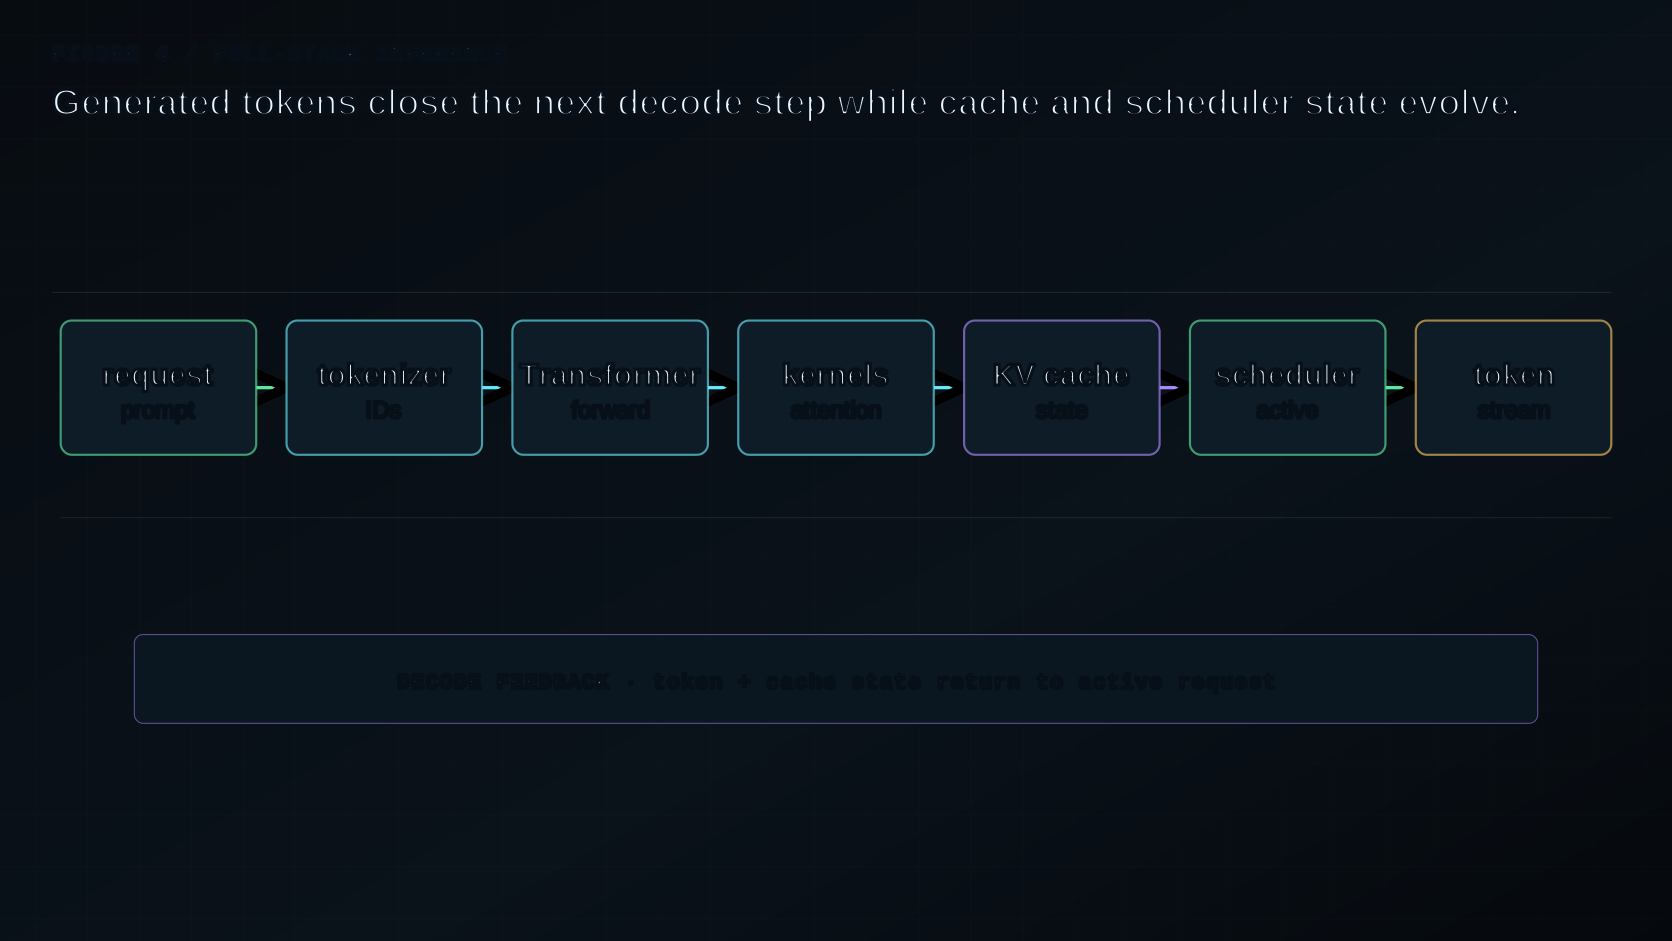
This picture is still simplified, but it shows the loop that matters: generated tokens feed back into decode, KV cache grows with every active sequence, and the scheduler revisits requests at each iteration.
Why This Series Starts With a Token
A token is small enough to follow, but it touches every layer that can explain a slow response. At the model level, it starts as an ID, becomes an embedding vector, gathers context, and contributes to logits. At the kernel level, its transformations become matmuls and attention kernels. At the serving level, prompt tokens fill cache, generated tokens extend cache, and finished requests release memory.
That makes the token a useful diagnostic handle. Inside the Transformer, it is a vector being transformed and routed. Inside the GPU, those transformations become matrix operations and memory movement. Inside the server, the same token belongs to a request competing for cache blocks and scheduler attention.
A component diagram makes the boundaries look fixed. The token crosses them.
The series then walks down the stack:
- Inside the Transformer: how tokens become contextual representations.
- Inside GPU matmul: why Transformer performance is mostly about matrix multiplication and memory movement.
- Inside vLLM-style serving: how many requests are scheduled around prefill, decode, and KV cache.
- Across the full stack: a unified diagnostic model for token, compute, memory, and request lifecycles.
- Inside reasoning effort: how hidden generated work changes quality, latency, cost, and serving capacity.
The central question is what happens between a user prompt and the next generated token. A slow response is not automatically a model problem, a CUDA problem, or a serving problem. It may come from architecture, kernel utilization, KV-cache pressure, batching policy, or the interaction among them.
Key Takeaways
- A slow token should be diagnosed across model architecture, GPU kernels, KV-cache memory, and request scheduling.
- The Transformer defines the work; kernels decide how much of the hardware that work can use.
- KV cache turns attention history into a capacity and allocation problem.
- Serving policy shapes time to first token, inter-token latency, throughput, and tail behavior.
- The first useful diagnosis names the failing layer before choosing an optimization.
Series Navigation
-
Series index: The Life of a Token Across the LLM Stack
-
Part 0: LLM Inference Is a Full-Stack Systems Problem (current)
-
Part 2: Why Transformer Performance Is Mostly a Matmul Problem
Citation
Please cite this article as:
Ji, Wenbo. “LLM Inference Is a Full-Stack Systems Problem”. fusheng-ji.github.io (May 2026). https://fusheng-ji.github.io/blog/posts/llm-inference-full-stack-systems/
Or use the BibTeX entry:
@article{ji2026llminferencefullstacksystems,
  title = {LLM Inference Is a Full-Stack Systems Problem},
  author = {Ji, Wenbo},
  journal = {fusheng-ji.github.io},
  year = {2026},
  month = {May},
  url = {https://fusheng-ji.github.io/blog/posts/llm-inference-full-stack-systems/}
}
References
- Aleksa Gordic, Inside the Transformer: The Life of a Token.
- Aleksa Gordic, Inside NVIDIA GPUs: Anatomy of high performance matmul kernels.
- Aleksa Gordic, Inside vLLM: Anatomy of a High-Throughput LLM Inference System.
- Vaswani et al., Attention Is All You Need.
- Dao et al., FlashAttention: Fast and Memory-Efficient Exact Attention with IO-Awareness.
- Kwon et al., Efficient Memory Management for Large Language Model Serving with PagedAttention.
- Leviathan et al., Fast Inference from Transformers via Speculative Decoding.
- Agrawal et al., SARATHI: Efficient LLM Inference by Piggybacking Decodes with Chunked Prefills.
Note: This blog was drafted and polished with assistance from ChatGPT, based on my reading notes on Aleksa Gordic's Transformer, matmul, and vLLM articles. Illustrations were generated with GPT Image 2.